Personal Care Product Listings Are Live Demand Signals. Here’s How Brands Use Them to Win
Most personal care brands look at product listings as static pages.
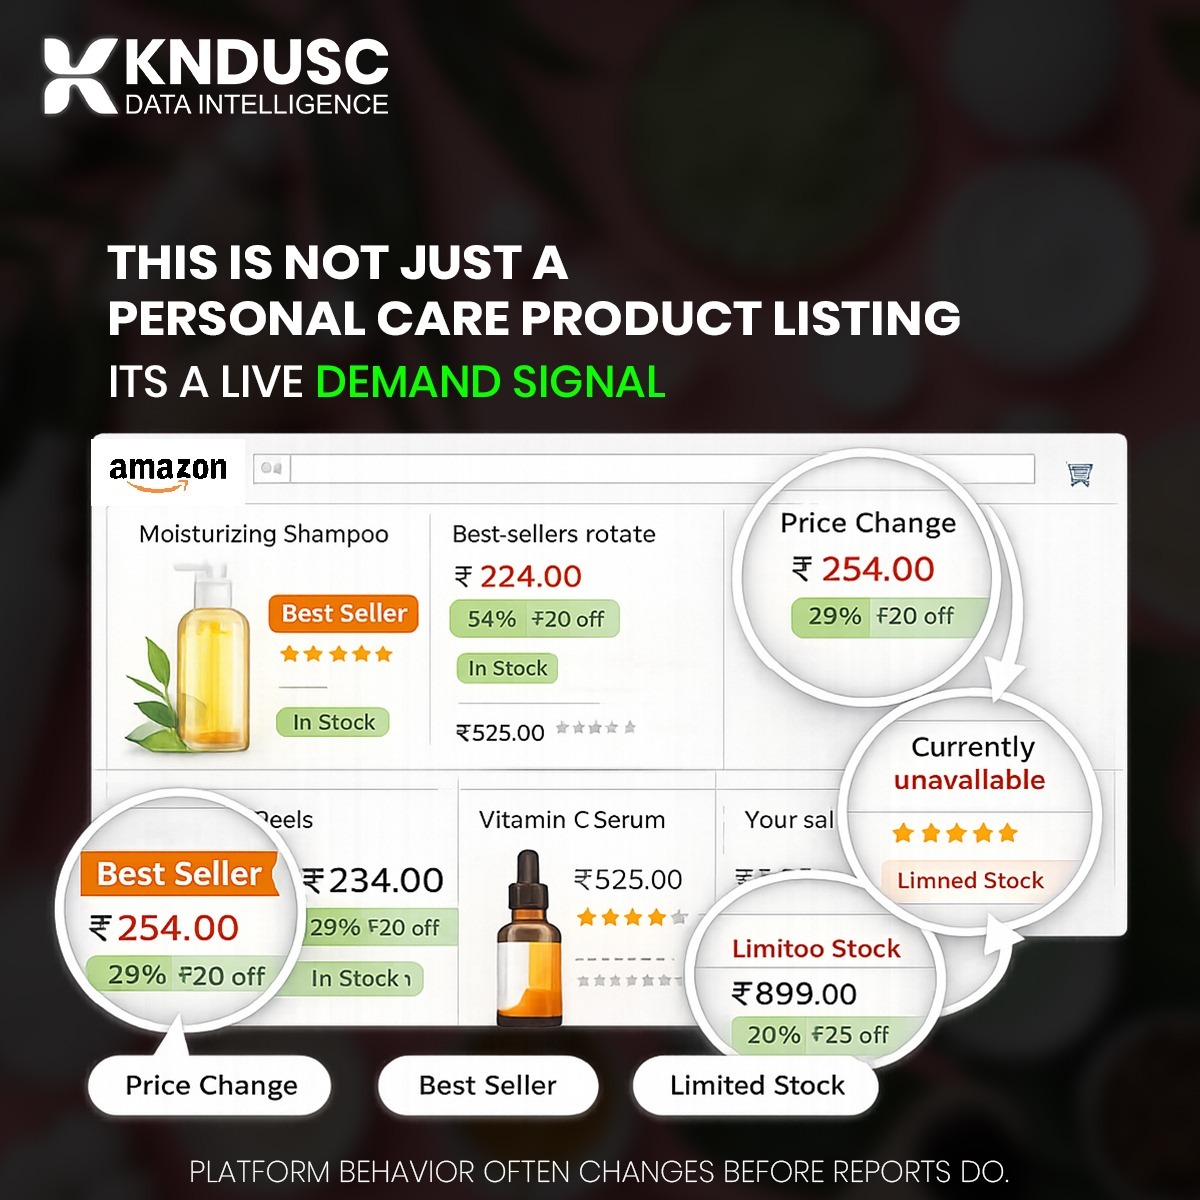
In reality, these listings behave like real-time demand indicators — constantly changing with customer behavior, competition, and supply movement.
For brands selling on marketplaces, missing these signals means reacting too late.
This article explains why personal care product data matters, what problems brands face without it, and how data intelligence turns listings into growth insights.
The Real Problem Brands Face in Personal Care Markets
Personal care is one of the fastest-moving categories online.
Prices, availability, and bestseller status can change multiple times in a single week.
Yet many brands still rely on:
- Monthly sales reports
- Manual competitor tracking
- Delayed marketplace dashboards
- Sudden stock-outs with no warning
- Price wars noticed only after margins drop
- Bestsellers losing momentum without explanation
Why a Product Listing Is Not “Just a Listing”
Every personal care product page reflects live customer demand.
Behind each listing are signals like:
- Price increases or reductions
- Bestseller tag movements
- Limited or unavailable stock
- Discount frequency changes
- Review velocity shifts
These signals show what customers are choosing right now, not what they chose last month.
Brands that monitor these signals gain early visibility into market shifts.
Key Personal Care Data That Drives Better Decisions
Price Change Intelligence
- Protect margins during discount cycles
- Identify competitor pricing strategies
Decide when to raise or hold prices
Stock Availability & Out-of-Stock Signals
Stock-outs are not random — they are demand indicators.
Monitoring stock status allows brands to:
- Forecast restocking needs
- Prevent lost sales
- Identify competitor supply gaps
Bestseller & Ranking Movement
Bestsellers rotate faster than most reports show.
Tracking ranking changes helps brands:
- Detect trending SKUs early
- Understand why certain products accelerate
- Adjust marketing and inventory focus
Discount & Promotion Patterns
Frequent discounts often indicate pressure or opportunity.
With discount tracking, brands can:
-
Avoid unnecessary price erosion
Time promotions more effectively
Understand competitor urgency
Why Traditional Reports Fail in Personal Care
Reports summarize the past.
Marketplaces move in real time.
By the time a report highlights:
Reports summarize the past.
Marketplaces move in real time.
-
A bestseller → demand already peaked
A stock-out → customers already shifted brands
A price drop → margins already lost
How Data Scraping Turns Listings Into Strategy
- Monitor live market behaviour
- Identify early demand signals
- Optimize pricing and inventory decisions
- React faster than competitors
it’s about turning raw marketplace activity into business clarity.
What Personal Care Product Data KNDUSC Scrapes from Amazon
Amazon personal care listings generate continuous market signals.
At KNDUSC IT Data Services, we extract structured data that helps brands understand pricing behavior, demand movement, and competitive pressure in real time.
Below is the key Amazon personal care data we provide:
Product Identification Data
This forms the foundation of all analysis.
We scrape:
- Product title
- Brand name
- Category & sub-category
- SKU / ASIN
- Pack size & variant information
This helps brands track exact competitor SKUs without confusion.
Pricing & Offer Intelligence
Price movement is one of the strongest demand indicators.
We collect:
- Current selling price
- MRP / list price
- Discount percentage & value
- Price change history (upward & downward)
- Lightning deals & limited-time offers
This enables brands to protect margins and avoid reactive pricing.
Stock Availability & Supply Signals
Availability often changes before demand becomes visible.
We track:
- In-stock / out-of-stock statusList item
- Limited stock indicators
- Availability changes over time
Bestseller & Ranking Signals
Bestseller tags reflect live buying behavior, not assumptions.
We scrape:
- Bestseller badge presence
- Category ranking position
- Ranking movement over time
Ratings & Review Intelligence
Reviews indicate trust and product momentum.
We extract:
- Average rating
- Total review count
- Review growth velocity
- Rating distribution
Seller & Fulfillment Insights
Seller behavior influences pricing and availability.
We collect:
-
Seller name
Fulfilled by Amazon (FBA) or merchant-fulfilled status
Buy Box ownership changes
Variant & Pack-Level Data
Demand often shifts between sizes and variants.
We track:
- Variant availability (size, flavor, formulation)
- Price differences across variants
- Bestseller movement by pack size
How Brands Use This Amazon Personal Care Data
- Forecast demand more accurately
- Optimize pricing strategies
- Prevent unexpected stock-outs
- Identify fast-moving SKUs early
- Monitor competitors continuously
Data Delivered in Business-Ready Format
- Excel / CSV
- Custom structured formats
- Scheduled or on-demand reports
Final Insight
Amazon listings change before sales reports do.
Brands that track live listing behavior stay ahead of the market.
If you’d like to see how this data looks in practice,
KNDUSC can provide a sample Amazon personal care dataset.
📩 Turn product listings into real demand intelligence.