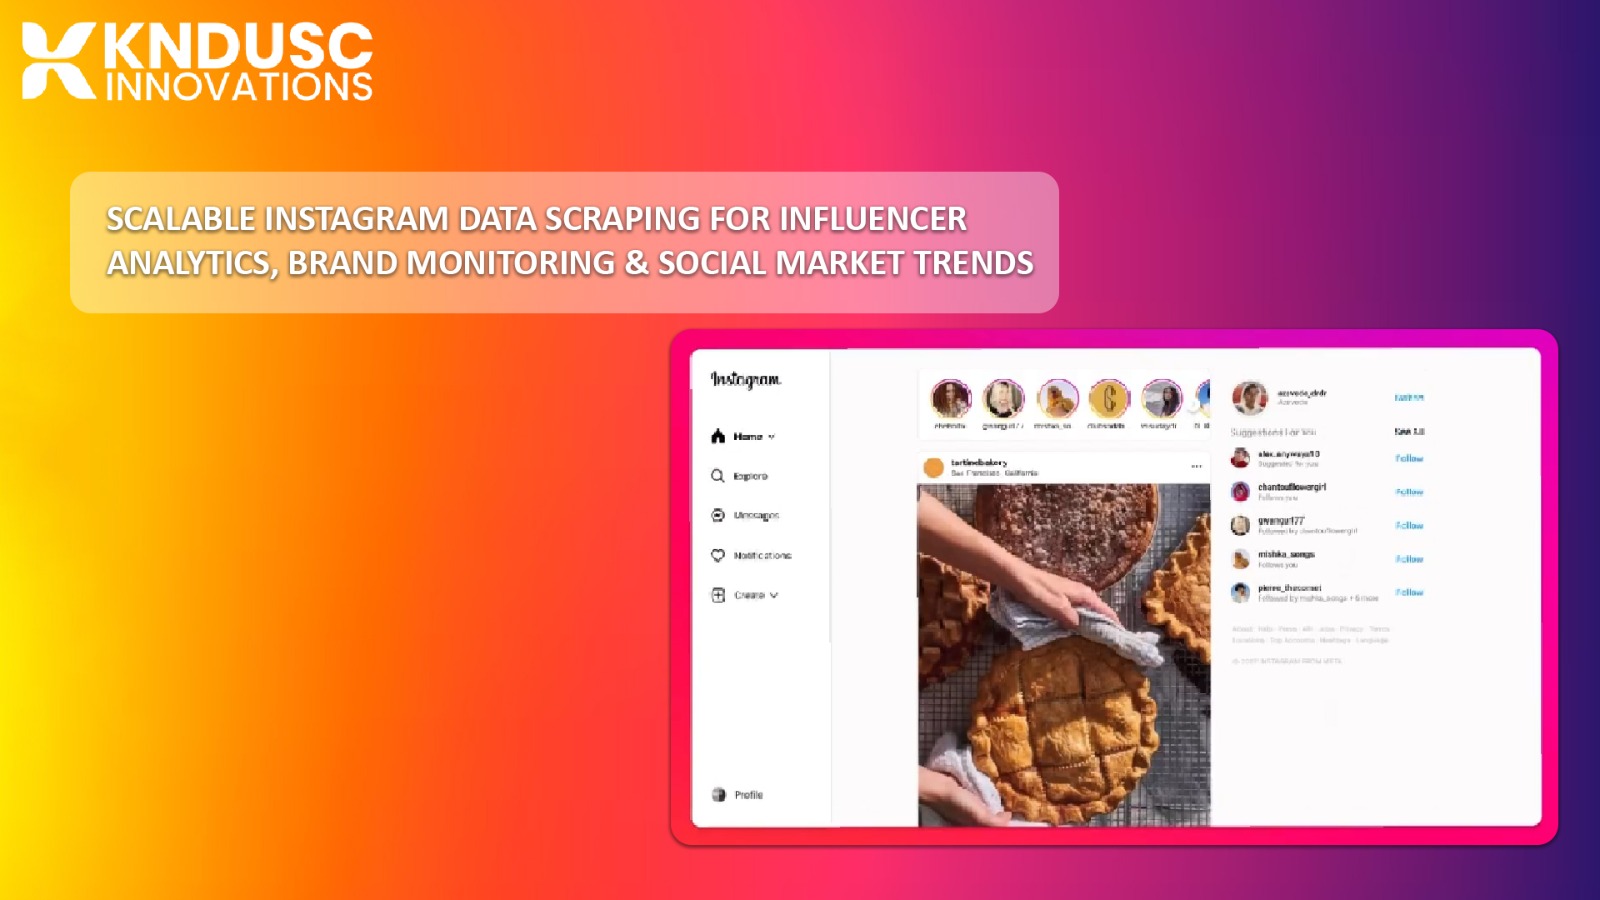
Instagram is not a social platform anymore, it is a live market intelligence feed.
Every public post, Reel, hashtag cluster, follower count shift, and engagement spike on Instagram's 2+ billion user base encodes a commercially readable signal. Brands are launching products through creator partnerships before a single ad budget is allocated. Consumer sentiment toward a category shifts inside comment sections weeks before it shows up in survey data. Niche communities form around aesthetics, lifestyles, and purchase behaviours entirely visible in public profile data, if you know how to extract it at scale.
The businesses that win in the next cycle of digital commerce are not the ones with the biggest Instagram presence. They are the ones extracting and acting on Instagram data faster than everyone else.
KNDUSC's Instagram Data Scraping service gives you that structural advantage influencer profiles, engagement signals, brand mention intelligence, and trend velocity data, delivered clean and continuously..
What Is Instagram Data Scraping?
Instagram data scraping is the automated, structured extraction of publicly available profile, post, engagement, and content metadata from Instagram delivered at scale, at scheduled frequencies, and normalised into formats ready for analytics platforms, influencer CRMs, brand intelligence dashboards, and social trend engines.
What makes Instagram uniquely complex as a data environment:
- Engagement rates vary wildly by creator tier a nano-influencer with 8,000 followers may outperform a macro with 500,000 on actual audience action
- Follower counts are a vanity metric without engagement ratio context raw numbers extracted in isolation are commercially misleading
- Hashtag communities evolve continuously a hashtag that drove 40% engagement six months ago may be algorithmically suppressed today
- Reel performance and carousel performance carry different signals for the same creator post-type breakdowns require structured data, not manual observation
- Brand mention velocity how fast a brand is being tagged in organic posts is one of the earliest indicators of community-level product resonance
KNDUSC's extraction infrastructure is built for all of these layers simultaneously.
What Data Can Be Scraped from Instagram?
Influencer & Creator Profile Intelligence
- Username, display name, bio text, and profile category tag
- Follower count, following count, and post volume
- Account type (personal, creator, business) and verification status
- Bio link URL and link-in-bio destination tracking
- Follower growth trajectory (week-over-week, month-over-month delta)
- Engagement rate calculated from recent post sample (likes + comments ÷ followers)
- Average likes per post, average comments per post, average saves (where available)
- Reel view count averages and video content performance ratios
- Sponsored content frequency ratio of paid partnership posts to organic content
Post & Content Intelligence
- Post caption text, hashtag set, and tagged accounts
- Post type classification (image, carousel, Reel, Story archive)
- Like count, comment count, and share/save proxy signals
- Posting frequency and content cadence patterns
- Top-performing posts by engagement within a profile or hashtag
- Mention and tag data which accounts are being organically referenced
- Content theme classification by visual category and caption keyword
- Post timestamp and day/time performance patterns
Brand & Competitor Monitoring Data
- Brand mention volume organic tagged posts by username or hashtag
- Mention sentiment context comment tone clustering around brand tags
- Share-of-voice mapping relative mention frequency vs. competitor brands
- Competitor follower growth rate vs. your brand's trajectory
- Competitor post frequency, content mix, and engagement trends
- Campaign launch detection sudden mention or engagement spikes around a brand
- Branded hashtag performance reach and post volume for owned hashtag campaigns
- Negative mention clustering early warning for reputation signals in comment data
Hashtag & Trend Intelligence
- Post volume per hashtag and growth trajectory over time
- Top-performing content within a hashtag sorted by engagement
- Emerging hashtag clusters newly forming communities gaining post velocity
- Related hashtag mapping which tags consistently appear together
- Geographic concentration of a hashtag where a trend is gaining traction first
- Category crossover signals when a niche hashtag begins appearing in mainstream feeds
- Trend decay rate how quickly post volume drops after a hashtag peaks
Audience & Demographic Signals
- Audience location signals derived from commenter and follower profile geography
- Language distribution across comment sections for multilingual audience mapping
- Audience interest overlaps what other accounts and categories followers engage with
- Follower quality indicators ratio of active vs. dormant accounts in a creator's base
- Gender and age demographic proxies from public profile metadata
The Five Instagram Data Signals That Actually Drive Business Decisions
Most Instagram data discussions stop at follower count and engagement rate. Those are table stakes. The intelligence that drives real business decisions lives a layer deeper.
Signal 1 — Engagement Velocity, Not Just Engagement Rate
A post that reaches a 6% engagement rate in the first two hours carries a fundamentally different signal than one that reaches the same rate over 48 hours. Engagement velocity the speed at which interaction accumulates is the leading indicator of algorithmic amplification. KNDUSC's time-stamped extraction captures this velocity window, not just the final number.
Signal 2 — Follower Growth Acceleration
A creator at 85,000 followers who added 12,000 followers in the last 30 days is a fundamentally different commercial opportunity than one at 200,000 followers who added 1,500 in the same window. Follower growth acceleration not absolute follower count is the metric that predicts where audience attention is consolidating. KNDUSC tracks longitudinal follower trajectories across creator watchlists at configurable intervals.
Signal 3 — Organic Brand Mention Momentum
When a brand begins appearing in organic posts without paid placement or gifted product disclosure at increasing frequency, it is one of the earliest detectable signals of genuine community resonance. KNDUSC monitors mention velocity for target brands and competitors, flagging inflection points before they become visible in sales data.
Signal 4 — Hashtag Community Formation Rate
A hashtag that doubles its post volume in 21 days while maintaining or improving its top-post engagement rate is forming a community, not just accumulating content. Community formation rate is how trends become markets. KNDUSC's hashtag velocity tracking detects this formation pattern early weeks before the trend is identifiable through mainstream media.
Signal 5 — Content-Audience Fit Ratio
A creator's engagement rate on paid partnership posts versus organic posts reveals how their audience responds to branded content — a critical metric that no influencer media kit discloses. KNDUSC extracts post-type performance breakdowns to surface this ratio, enabling brands to evaluate creator-audience fit before committing budget.
Business Use Cases: Who Uses Instagram Data Intelligence and How
1. Influencer Discovery & Tier Intelligence — Finding the Right Creators Before Their Rates Double
The influencer market has fragmented beyond what any manual research process can track. New creators break through niche communities weekly. Micro and nano-influencers consistently outperform macro accounts on cost-per-engagement — but identifying them at scale requires systematic data extraction, not scrolling.
- Build a continuously refreshed creator database filtered by niche, engagement rate, follower tier, and content category
- Identify creators with accelerating follower growth before they move into a higher rate tier
- Filter for creators with low sponsored content ratios indicating an audience not yet fatigued by paid partnerships
- Cross-reference creator audience geography for campaigns targeting specific city, state, or country markets
- Track which creators consistently produce top-performing content within target hashtag communities
2. Campaign Performance Benchmarking — What Good Looks Like in Your Category
Before briefing a campaign, brands need to know what benchmark engagement looks like for their category — not across all of Instagram, but specifically for the creator tier, content type, and niche they are operating in. Without external data, every campaign is benchmarked against internal history alone.
- Extract engagement rate distribution for creators in your category by follower tier
- Build category-specific benchmarks for Reels vs. carousels vs. static posts
- Identify which content formats are gaining engagement share in your niche right now
- Monitor competitor campaign performance by tracking engagement spikes around their creator partnerships
- Track campaign reach proxies through hashtag adoption rates post-campaign launch
3. Brand Monitoring & Reputation Intelligence — Real-Time Awareness of What the Market Is Saying
A brand that learns about a reputation issue from a news headline has already missed the intervention window. The signal starts in comment sections and organic mention clusters days sometimes weeks before it reaches media coverage. Structured Instagram monitoring closes that gap.
- Monitor brand mention volume, velocity, and sentiment context continuously
- Detect sudden negative mention clustering early warning for emerging reputation risks
- Track share-of-voice against competitor brands week-over-week
- Identify which creators are organically mentioning your brand potential authentic partnership candidates
- Monitor competitor campaign launches through sudden engagement or mention spikes around their brand handles
4. Product Launch Intelligence — Validating Demand Before You Scale Investment
Instagram's creator and community ecosystem often validates consumer demand before purchase data confirms it. Products that generate organic user content unprompted posts, review-style Reels, haul inclusions before a formal campaign launches are the ones with genuine pull. Extracting this signal before scaling ad spend is a capital allocation advantage.
- Track organic post volume for product category keywords and relevant hashtags pre-launch
- Monitor competitor product launches through tagged mention and creator engagement patterns
- Identify which product formats and aesthetics are generating the highest organic engagement in your category
- Detect early community formation around a product concept the clearest pre-market validation signal available from public data
- Extract comment sentiment around competitor products to identify the gaps your launch can address
5. Social Trend Detection for Market Research — Reading Where Consumer Culture Is Moving
Fashion, beauty, food, fitness, home, and parenting every consumer category has a leading edge on Instagram that precedes mass market adoption by 3 to 18 months. The communities, aesthetics, and vocabularies forming on the platform today are the briefs that product teams, retailers, and marketing strategists will be executing against in two seasons.
- Track emerging hashtag community formation rates across target categories
- Monitor content theme shifts — which visual aesthetics and product formats are gaining post share
- Identify geographic trend origins where a consumer behaviour is gaining traction first
- Extract creator content vocabulary to detect new terminology entering a category before it becomes mainstream
- Build monthly trend velocity reports across multiple verticals for category strategy and retail buying teams
6. Competitor Intelligence — A Continuous Feed on What Your Competition Is Building
Competitors announce their strategies on Instagram before they announce them in press releases. New product teases, creator partnership activations, campaign hashtag launches, audience growth investments all of it is encoded in public profile and content data, accessible through structured extraction.
- Monitor competitor follower growth trajectories and engagement trend direction
- Track competitor posting frequency and content format mix changes as strategy signals
- Detect competitor creator partnerships before they go public through engagement spike pattern recognition
- Monitor branded hashtag performance for competitor campaigns in real time
- Compare share of creator mentions which brands are being referenced most often in organic content within a category
7. Investor & Analyst Social Intelligence — Instagram Data as a Market Signal Layer
For investment analysts, venture teams, and strategy consultants, Instagram's public data is a market signal layer that financial data alone cannot provide. Brand momentum, category growth rates, and consumer sentiment shifts are visible in social data months before they appear in earnings reports.
- Track brand mention velocity as a leading indicator of consumer demand momentum
- Monitor category hashtag growth rates as a proxy for expanding market interest
- Extract creator partnership frequency for a brand as a proxy for marketing investment intensity
- Compare audience growth trajectories across competing brands within a sector
- Use content velocity and engagement trend data to inform sector thesis and due diligence analysis
Instagram Data vs. Other Social Platforms: Where the Intelligence Edge Lives
| Capability | TikTok | Twitter/X | YouTube | ||
|---|---|---|---|---|---|
| Influencer discovery at scale | Excellent | Excellent | Moderate | Limited | Good |
| Brand mention monitoring | Excellent | Moderate | Excellent | Good | Limited |
| Visual trend detection | Best in class | Best in class | Limited | Limited | Good |
| B2B audience intelligence | Limited | Limited | Good | Best in class | Moderate |
| Consumer sentiment depth | Excellent | Good | Excellent | Moderate | Good |
| Hashtag community analysis | Excellent | Excellent | Good | Limited | Limited |
| Creator engagement benchmarking | Excellent | Excellent | Moderate | Limited | Good |
| Product launch signals | Excellent | Excellent | Good | Limited | Moderate |
| Geographic trend origin tracking | Good | Good | Good | Limited | Limited |
| Anti-scraping complexity | High | High | High | High | Moderate |
For consumer brand intelligence, influencer discovery, and visual trend tracking — Instagram remains the single richest public data source available. TikTok leads on short-video trend velocity. LinkedIn owns B2B audience intelligence. Instagram is the anchor platform for any brand operating in consumer goods, fashion, beauty, food, or lifestyle categories.
Sample Dataset: Instagram Influencer Intelligence Output
| Creator Handle | Niche | Followers | Eng. Rate | Avg. Likes | Avg. Comments | Reel Views | Follower Growth (30d) | Location |
|---|---|---|---|---|---|---|---|---|
| @wellnesswith_ria | Health & Wellness | 84,200 | 6.8% | 5,240 | 487 | 38,500 | +4,300 | Mumbai |
| @streetstyle.karan | Men's Fashion | 212,000 | 3.1% | 6,120 | 241 | 72,000 | +1,900 | Delhi |
| @theplantbasedchef | Food & Recipes | 47,600 | 9.2% | 3,810 | 577 | 29,400 | +3,100 | Bengaluru |
| @techunboxguy | Consumer Tech | 318,000 | 2.4% | 7,200 | 189 | 95,000 | +2,200 | Hyderabad |
| @fitlifesneha | Fitness | 61,400 | 7.5% | 4,220 | 398 | 44,100 | +5,700 | Pune |
| @homesbypriya | Interior Design | 29,800 | 11.3% | 2,940 | 450 | 18,600 | +2,800 | Chennai |
| @skincarebyneha | Beauty & Skincare | 156,000 | 4.9% | 7,100 | 312 | 61,200 | +3,400 | Ahmedabad |
Engagement rate = (avg. likes + avg. comments) ÷ followers × 100. Follower growth = 30-day absolute delta.
Real-World Intelligence Gap: A Beauty Brand's Blind Spot
A mid-sized D2C beauty brand was investing ₹40L per quarter in influencer campaigns briefing creators through an agency, tracking performance manually through screenshot reporting, and reviewing results monthly. Their campaigns were generating reach. Conversions were inconsistent.
What they lacked:
- No structured view of which creator tiers were actually driving engagement in their product category
- No visibility into competitor brand mention velocity whether share-of-voice was shifting
- No early detection of emerging skincare ingredient trends forming in niche hashtag communities before mainstream adoption
- No creator-level paid post frequency data meaning several contracted creators had saturated audiences already fatigued by constant brand partnerships
- No benchmark data on what a strong engagement rate looked like for their product category and creator tier combination
The result was a campaign selection process driven by follower count and rate card the two least predictive variables for actual campaign performance.
How KNDUSC Closes the Instagram Intelligence Gap
KNDUSC deployed a fully managed Instagram data extraction and intelligence pipeline covering the brand's creator watchlist, competitor brand set, and target category hashtag cluster.
- Creator Intelligence Layer: Continuous tracking of 400 creators in the skincare and beauty niche engagement rate, follower growth velocity, paid post ratio, and Reel vs. static performance breakdown. Updated weekly.
- Competitor Brand Monitoring: Daily mention volume tracking for 6 competitor brands across organic posts, story tags, and Reel captions. Mention velocity alerts triggered when any brand's weekly mentions exceeded 2× their 30-day baseline.
- Trend Hashtag Surveillance: Weekly extraction of post volume and top-content engagement for 80 skincare-adjacent hashtags. Community formation alerts when any hashtag exceeded 25% weekly post volume growth.
- Output: A weekly intelligence brief fed directly into the brand's planning dashboard creator shortlists ranked by engagement efficiency score, competitor mention trend summaries, and emerging ingredient trend flags sorted by community formation velocity.
- Outcome: Within two campaign cycles, the brand replaced 40% of their creator roster based on engagement efficiency scoring rather than follower count. Three ingredient trend alerts from hashtag surveillance were actioned by the product team two resulted in new SKU development; one informed a limited-edition launch that generated 3× the organic mention volume of any previous release.
- Data Delivery & Refresh Schedule
| Data Layer | Fields Included | Refresh Frequency | Best For |
|---|---|---|---|
| Creator Profile Snapshot | Followers, engagement rate, bio, post count, verification | Weekly | Influencer CRM, tier lists |
| Post Performance Feed | Likes, comments, captions, hashtags, post type, timestamp | Daily | Campaign benchmarking, content strategy |
| Brand Mention Monitor | Mention volume, velocity, context text, tagger profile | Daily | Brand intelligence, reputation alerts |
| Hashtag Trend Tracker | Post volume, top posts, growth rate, related tags | Weekly | Trend detection, market research |
| Competitor Intelligence | Follower delta, engagement trend, posting frequency, paid post ratio | Weekly | Competitive strategy |
| Audience Signal Layer | Commenter geography, language mix, follower quality proxy | Monthly | Audience profiling, campaign targeting |
Why KNDUSC for Instagram Data Scraping?
- Scale Without Compromise KNDUSC's infrastructure handles multi-account, multi-hashtag, multi-geography extraction simultaneously hundreds of creator profiles, dozens of brand handles, and thousands of hashtag data points in a single pipeline run.
- Structured Output, Not Raw HTML Every data point arrives normalised and schema-mapped. No manual cleaning. Plug directly into your influencer CRM, analytics dashboard, or BI platform.
- Longitudinal Tracking One-time snapshots tell you where things are. KNDUSC's continuous extraction tells you where things are going follower trajectories, engagement trend directions, mention velocity curves, and hashtag community growth arcs over time.
- Custom Intelligence Layers Need creator scoring built on your specific weighted metrics? Competitor benchmarking across a custom brand set? Trend detection for a specific product category? KNDUSC configures extraction and delivery pipelines to your exact intelligence requirements.
- Ethical, Compliance-First Extraction KNDUSC extracts only publicly available Instagram data profiles, posts, and content metadata visible to any logged-out visitor operating within ethical scraping guidelines and applicable data protection frameworks.
The intelligence you need is already public. You just need the infrastructure to read it.
Stop briefing campaigns based on follower count. Stop learning about brand reputation issues from your PR agency. Stop missing the trend your competitor is about to build a product around.
👉 Request a Free Instagram Data Sample kndusc.com 📩 Book a Consultation with a Social Intelligence Specialist
Custom pipelines for D2C brands, marketing agencies, FMCG companies, retail intelligence teams, and investment analysts. Weekly delivery. Any format. No lock-in.